
According to the U.S. Initial and Continuing Unemployment Claims line chart (Chart 1) below from NYC Comptroller Scott M. Stringer, it shows that the unemployment claim numbers have not been below 1 million since the start of the pandemic. That is an indicator of how painful that this economic downturn has been. And once it gets closer to dropping below 1 million, we will be closer to adding more jobs than shedding jobs. So we are still in a place that is not good. The longer this drags on, the slower it would take for us to come back and for the economy to come back.
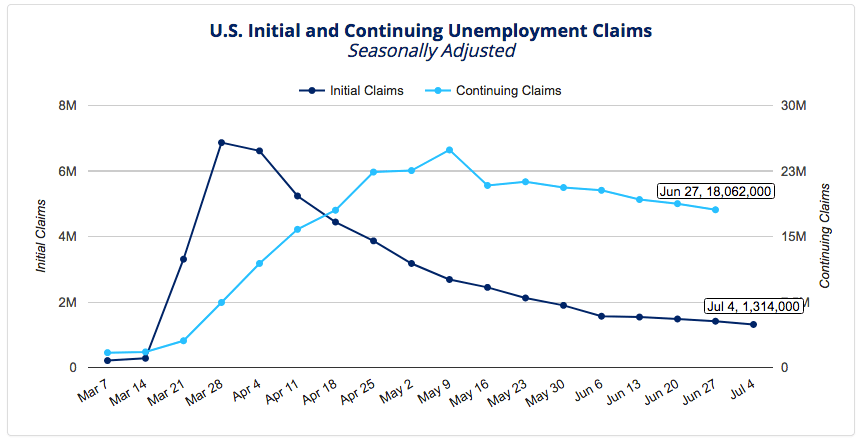
The same thing goes for continuing claims. The chart depicts that these claims have been pretty flat since mid-May. There was a positive jobs report in June nationally, but this is probably going to tick up again as we are seeing with Texas, California, Arizona, Florida starting to boom with Coronavirus recently. As more and more vulnerable individuals become infected, we’ll see their economies re-closing and this will mean that we will see numbers creep back up again (slowly or rapidly).
According to the data from the New York State Department of Labor, initial/new claims are 1.3 million between June 27th to July 4th, 2020 with 14 consecutive weeks of 1 million new claims. For point of comparison on active/continuing claims, there was a total of 18 million as of June 27th, 2020 compared to 1.7 million from June 29th, 2019. That is ten times as many unemployment insurance benefits claims. At this rate, it was really important that the federal government passed that law to extend the duration of unemployment so that it would buy us more time for us to put together the strategy, systems, approaches, treatments to be able to deal with the pandemic so that the economy could come back a little more easily. But as we are all aware, this isn’t exactly happening yet.
So to summarize this all together, there was a total of 47.3 million applications between March 7th to June 25th, 2020 and a total of 30.5 million claims between March 7th to June 6th. There is a difference between those two things. There are many applications and claims that have not been reviewed or approved yet, due to the influx.
As a point of comparison, the Great Recession – dating back to 2008 – 2009, the total unemployment claims over the span of 18 months was 37 million claims. However, in our case right now in 2020, we have achieved that in the span of 2.5 months, which is a living nightmare.

Scott M. Stringer’s Chart 2 above depicts the Regular Unemployment Insurance (UI) vs. Pandemic Unemployment Assistance (PUA). If you look at the last bar on June 20th, almost half of the continuing claims fall in the PUA category. The PUA is a special, new category of eligibility for unemployment that Congress and the federal government passed so that freelancers, self-employed and gig workers could claim unemployment insurance – which has never happened before. This is the first time in history to create this – which is a vital thing to point out about this downturn from previous ones.
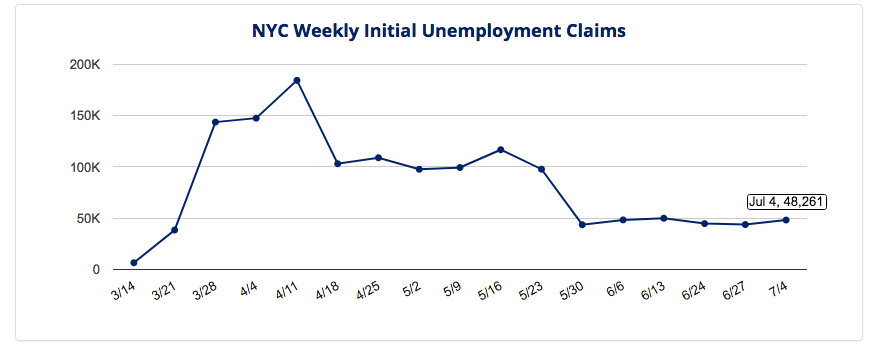
Scott M. Stringer’s Chart 3 above depicts New York City unemployment claims. We have currently – 48,261 initial/first time unemployment claims as of July 4th, 2020. Please note that this is not continuing claims. You can still see that the trend is still flat; it’s not trending down. It is still the number that we had in the end of March – but slightly higher.
If New York City’s economy might have to re-close and if it needs to go back on PAUSE, we might see that number go back up again if it’s a new category of workers who haven’t filed for a claim before. But, as we all know, if one has reached their maximum, permitted amount of weeks of unemployment, you cannot reapply until you get to the next 12 month cycle.
For national rates, the unemployment rate was 14.7% on April 2020 – which is the official unemployment rate, excluding discouraged workers. By June 2020, the unemployment rate was 11.1% – which most of those were rehired temporary layoff workers. We are unsure as to if furloughed workers fall into this category. It really depends on each employer and if they are using a formal and official word to describe what they are doing with their employees, OR in most cases, if they’re calling them furloughed when it turns out to actually be a temporary layoff.
As mentioned above, questions that arise are those who were furloughed, do they count as employed or unemployed? I believe that being furloughed counts as being employed. However, you can collect unemployment if you are furloughed but I am not sure if you are counted as part of the unemployment rate. If their employer indicates that their job will be available when they return to them, they would be employed. However, those furloughs tend to be less common than what’s called a temporary layoff and they may have a high prospect of returning back to work.
The Great Recession peak was 10-11%. So the longer that the current national rate (14.7%) is above the Great Recession peak, which is what it seems like in this case, will take us longer to recover.
According to the U.S. Bureau Labor of Statistics, 3.9 million individuals were employed in NYC as of February 2020. By May 2020, 2.9 million individuals were employed – which shows that that there was a 25% loss in jobs. On the other hand, 138,000 individuals in NYC were unemployed on February 2020. By May 2020, 662,000 individuals were unemployed.
What’s interesting about this, is that the current official unemployment rate in New York City is the greatest among Asian workers – which is 25%, followed by Black workers – which is 24%, then Hispanic/Latino workers – which is 23%, while White workers fall into 11%. This is an indicator of the disparate and inequitable economy that we live in and have been living in for decades.
The U.S. Bureau of Labor Statistics released an insightful report on the Current Employment Statistics Highlights on changes in jobs, job losses and job gains in both private and public sectors from dating from January 2010 through June 2020.
The Occupational Outlook Handbook also has a useful graph on the Fastest Growing Occupations.
For more up to date New York State labor market information resources, see below.
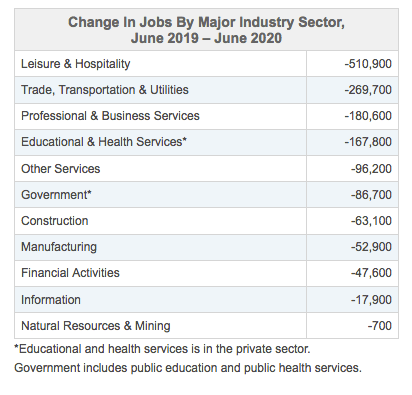
According to NYS Department of Labor, “Since June 2019, the number of nonfarm jobs (private plus public sectors) in New York State decreased by 1,494,100, or 15.1 percent, and the number of private sector jobs decreased by 1,407,400, or 16.8 percent. Additional industry detail is presented in the table below.”

Your place is valueble for me. Thanks!…
LikeLike